How to access the Monitoring window
Clicking a player checkbox selects it so you can confirm its status in the monitoring window.
Click here for the Monitoring video tutorial.
Accessing the Player Monitoring Window
To access monitoring data, click the player’s status checkbox and then click the Monitoring button above the player list.
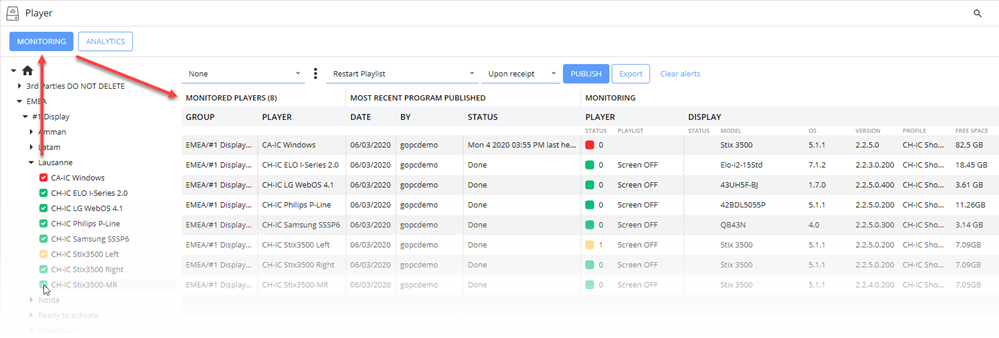
From this window you can access the player’s monitoring information to determine its current state, access any recorded alerts of events, and publish content.
The Monitoring Table
MONITORED PLAYERS SECTION
The table is organized in the following columns:
Group: Shows the selected player’s group(s).
Player: Shows the name of the selected player(s).
MOST RECENT PROGRAM PUBLISHED SECTION
Date: Shows the date of the last player update sent (essentially, the last time someone clicked the PUBLISH button).
By: Shows the user name of the last person who published the last update. If the Auto-Update function is enabled, this column will display the time the last auto-update was sent, until someone publishes a new update.
Status: When a user clicks the PUBLISH button, programming instructions and required content are sent to each selected players. The STATUS column will display the file transfer progress. The STATUS column will display “Done” once the player has received its update.
If the Player is currently offline, the Last recorded heartbeat date and time will be shown in the STATUS column.
Note for Navori Cloud users – the time shown is the based on the UTC Time Zone. You must convert this value to your local time zone. On-Premise server users will see the local server time.
MONITORING SECTION
PLAYER
Status: Shows the status indicator color (green, yellow, red), the number of recorded alerts since last reset.
Playlist: Displays the name of the currently playing playlist. You will also be able to tell when the player is displaying the Default Media (which means there is no current programming scheduled for this player), or the initial default media (meaning this is a newly activated player that has not yet received its first update).
DISPLAY
Status: These columns will show the display’s status indicator (green, yellow or red).
Model: The model of the media player device (for example the QL Stix or System-on-Chip device model number).
OS: The version of the operating system currently installed on the media player device.
Version: The QL Player software version currently installed on the media player device.
Profile: The name of the QL Player Profile assigned on the media player device.
Free Space: The amount of free storage space available on the media player device.
NOTE: The Display section will only show information in one of the following instances:
- When the player is a Windows PC equipped with the Navori QL RS-232 add-on software. Also, the PC and connected display must be both equipped with a RS-232 port and be connected by a RS-232 cable.
- When the player is a Navori QL Stix 3500 connected to a HDMI – CEC compatible display using a HDMI – CEC compatible video cable.
- When the player is a System on Chip (SoC) display that can send back status information (Samsung Tizen, Panasonic, Philips, EloTouch…)
Creating and Managing Monitoring Queries
Queries are meant to assist users when monitoring the status of large numbers of players. The idea behind queries is to give users the ability to enter and save specific search parameters that can be called up using a pull down menu. Basically, queries let you filter the results in the Monitoring window. For example, you can create queries that only show players with a red status, or players that are currently online (meaning they are showing a green or yellow status). Users have access to several parameters they can set to quickly access the information they need, regardless of the number of players selected.
Creating a New Query
Click the 3-dot button located to the right of the query selection field.
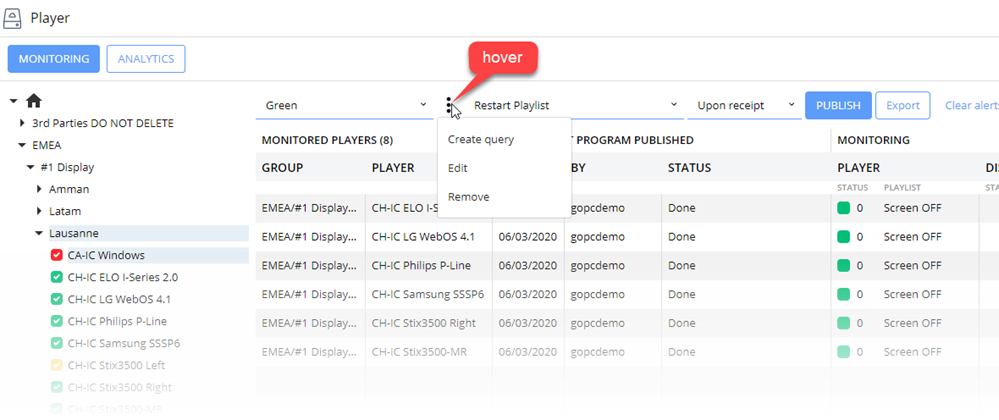
To add a new query to the list, click Create query. A new window will appear.
Enter a descriptive name for the new query. In this example, we created a query that filters the results so only players with a red status will appear in the list.
Next, select red as the Player Status.
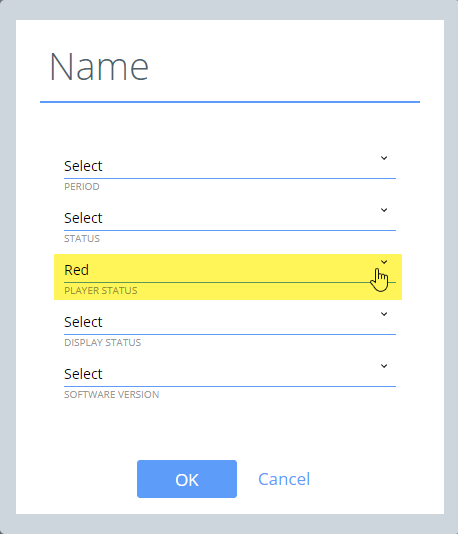
Click OK to save your new query.
The new query will now appear when you click on the pull-down field.
Result… You only see players with a red status. Other selected players have been removed from the results.
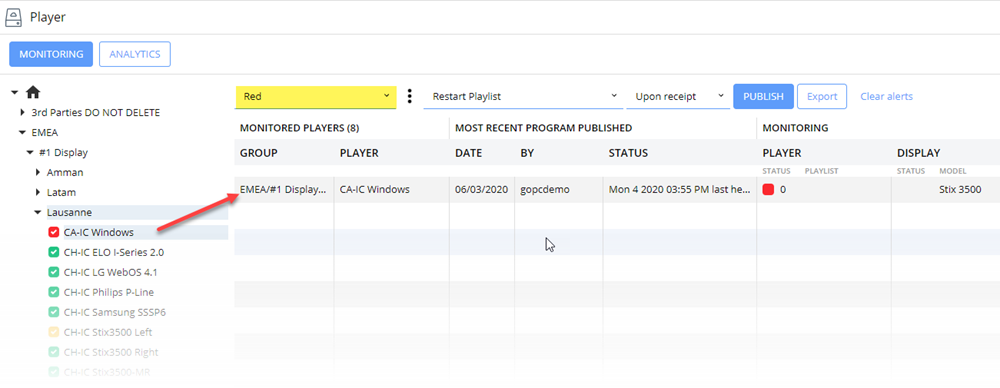
To disable the query and return to the default view, select “None” from the pull-down menu.
Query Options
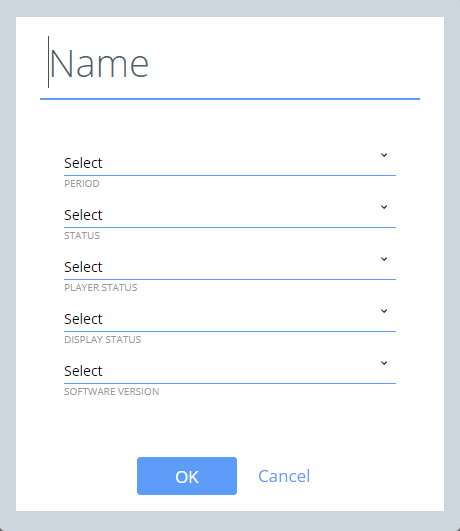
Name: Enter a descriptive name for your new query.
Period: Select a period from the list to filter results by time period.
Status: Select from currently downloading content or download complete.
Player Status: Select from player currently running, showing a green, yellow or red status.
Screen Status: Select from screen active or inactive.
Software Version: Select from current or previous QL software version.