Dashboard
The Server Dashboard provides useful server performance information.
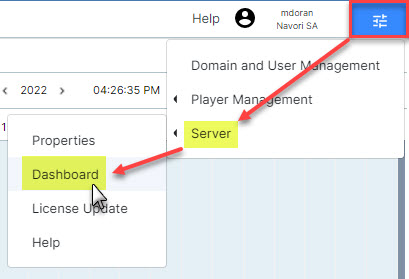
To access this option, select Main Menu > Server > Dashboard
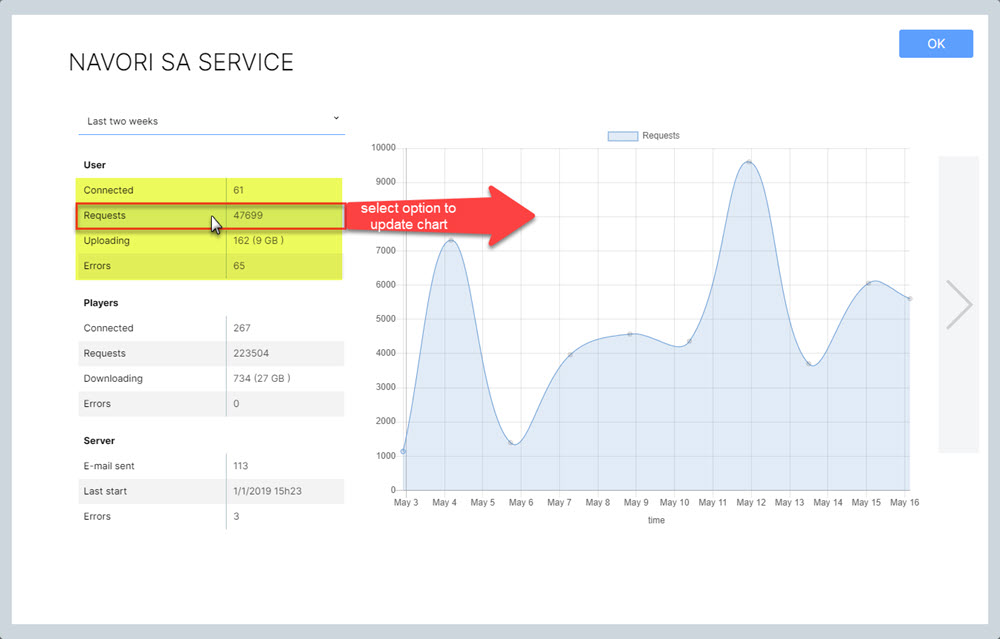
QL Server Dashboard (Screen 1)
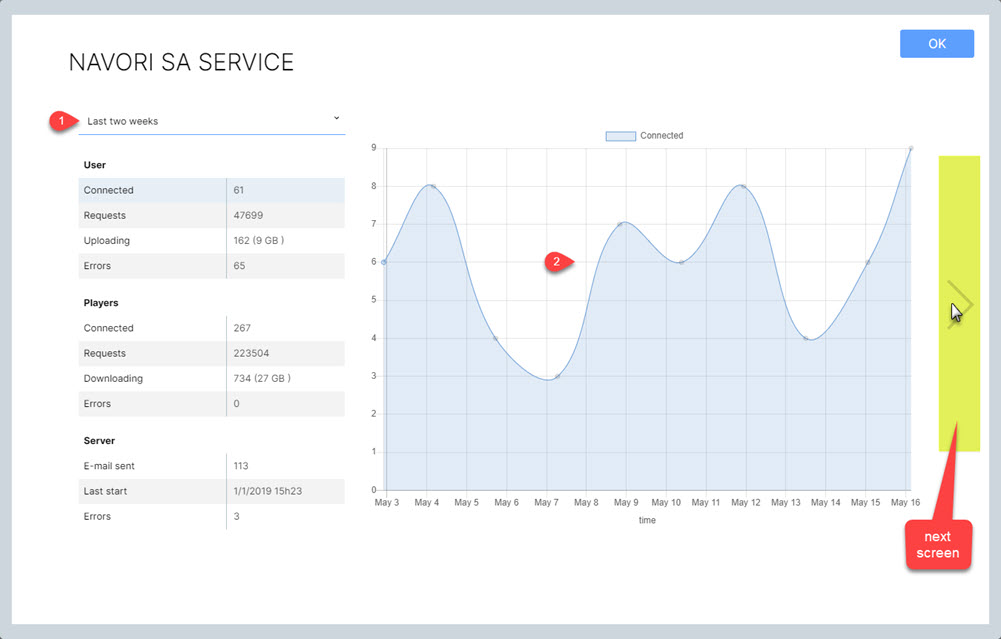
1. Statistics
The left side of the screen shows statistics related to users, players and QL Server activity.
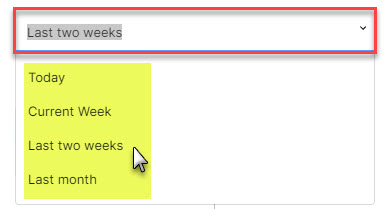
Administrators can select the period to retrieve via the pull-down menu above the tables.
2. Interactive Graph
The graph on the right side will update according to the table cell selected on the left of the screen.
In this example, the User > Requests have been selected and the graph shows the results graphically.
QL Server Dashboard (Screen 2)
Administrators can generate server activity reports from this screen.
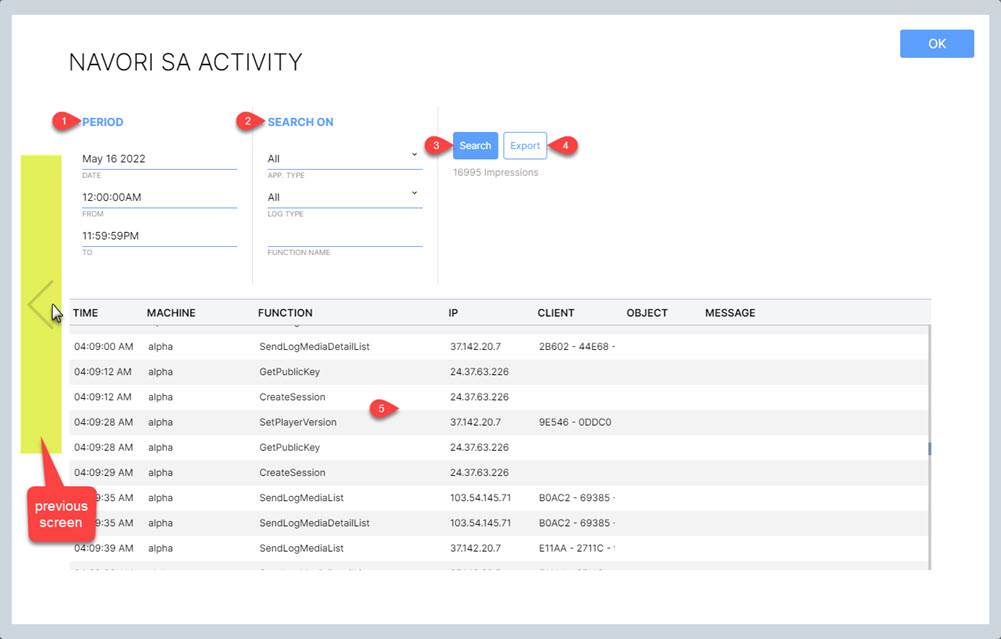
1. Period
Enter the date and start/end times for your report.
2. Search On
Results can be further refined and organized by selecting these filters:
App. Type: Options are All, User, Players and Server.
Log Type: Options are All, Request and Error.
Function Name: Enter the function to filter on.
3. Search button
Click to generate a new report based on the filters in sections 1 and 2.
4. Export button
Click to export your results to a CSV file.
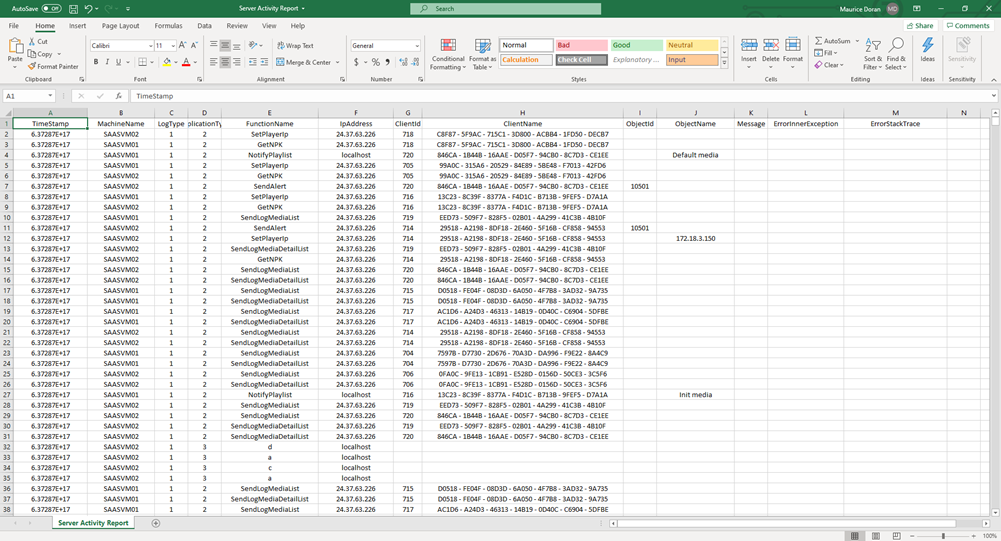
Here is a typical Server activity report opened in Microsoft Excel: